It’s becoming a familiar headline: US household debt keeps climbing and delinquency rates keep rising. According to the Federal Reserve Bank of New York’s Quarterly Report on Household Debt and Credit, household debt rose to $17.69 trillion in the first quarter of 2024. The report showed 6.9% of credit card debt transitioned to serious delinquency in the first quarter, with approximately 4.8% of consumers holding some debt in third-party collections.
Overall, 77% of American households have at least some type of debt, but that debt isn’t evenly distributed—and consumer spending habits can vary just as much depending on income level.
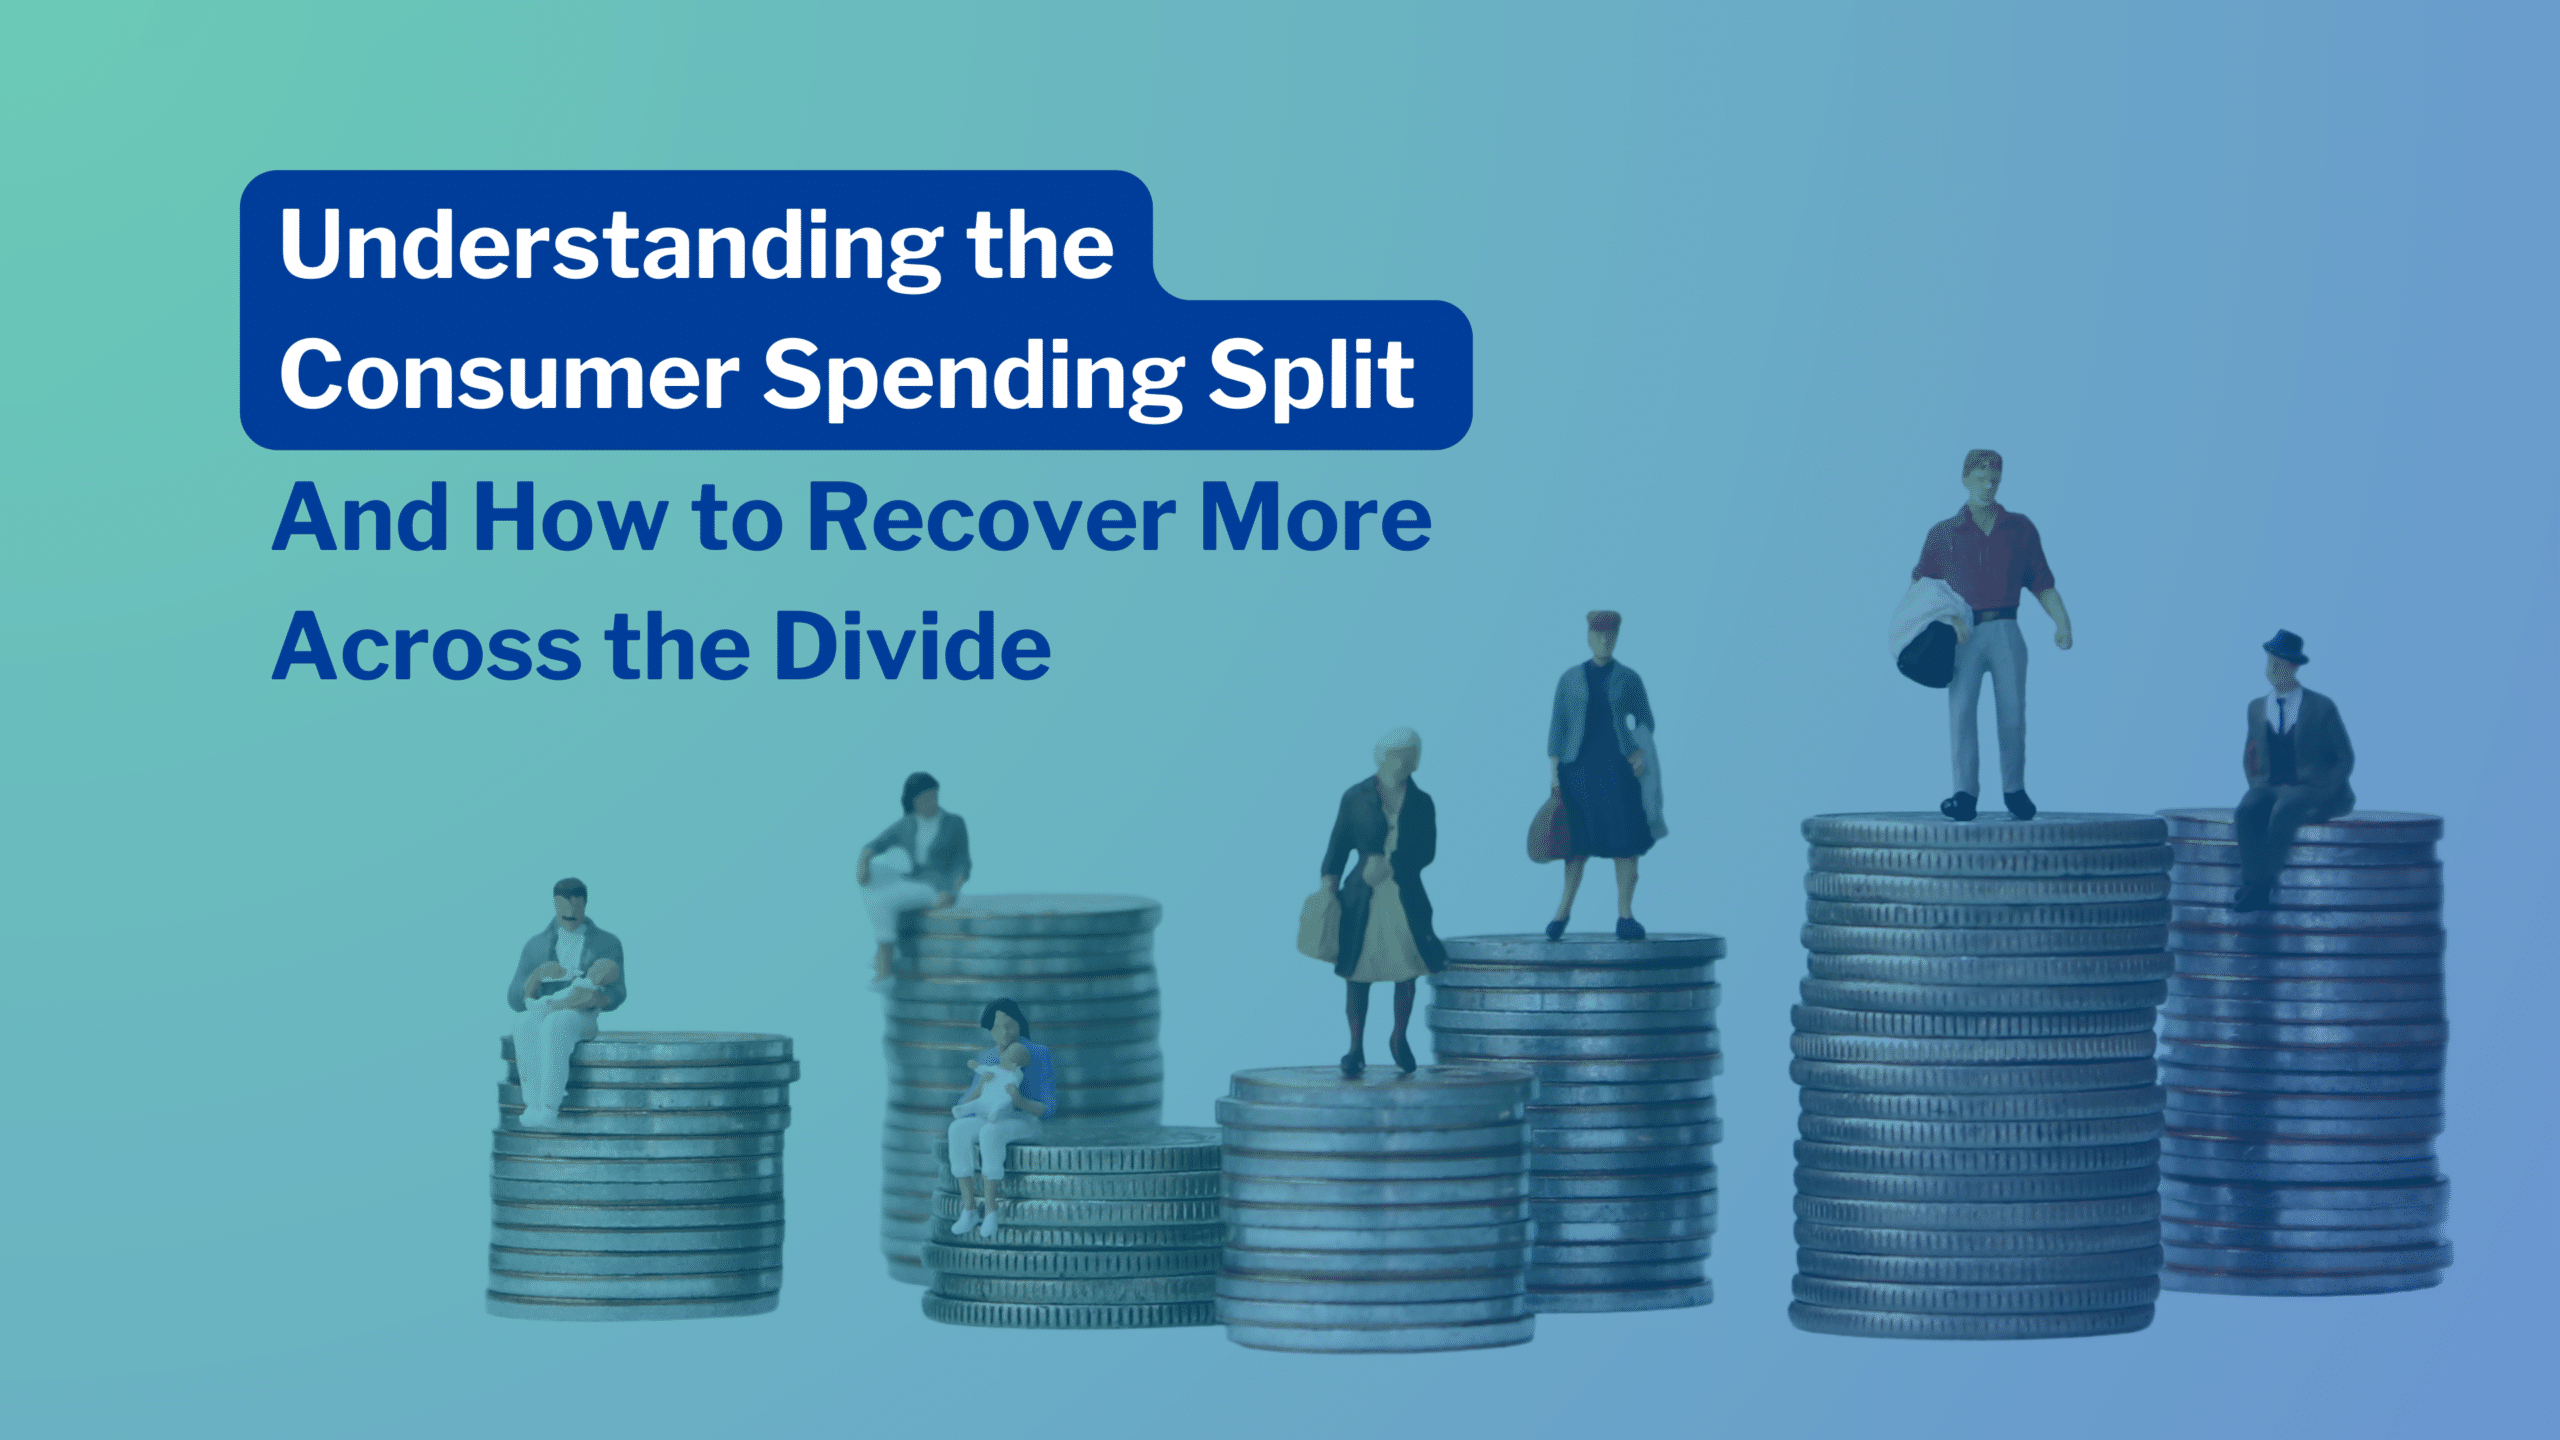
Understanding the split in consumer spending and its impact on household debt—and in turn, collections—is critical for today’s debt recovery strategies. While across the board debt may be climbing and delinquencies rising, your consumer engagement approach and communications to secure repayment cannot be one-size-fits-all for all consumers.
What is the Consumer Spending Divide?
Spending divide. Split-spending patterns. A tale of two consumers. Two-speed economy…all of these naming conventions describe the widening gap between income levels, spending habits, and inevitably types of debt accumulated.
While the last few years showed consistent spending rates across all income groups as a result of pandemic-era benefits, savings surplus, and wage growth, this is no longer the case. More recent data has revealed that as pandemic savings declined at the same time as both inflation and interest rates increased, lower-income households are becoming more financially strained while higher-income households are mostly unaffected.
Today, we see more affluent consumers continue to spend at consistent rates, while more middle- and lower-income consumers’ personal disposable income has not kept pace with rising prices and as a result, these households have become more indebted.
Even when there is a spending uptick in the lower-income sector, as seen in April 2024, what these consumers are spending on and how they are paying for it is still quite different from their higher-income counterparts. These spending patterns show that lower-earning consumers are putting more everyday bills on credit cards—and in turn, credit card delinquencies and charge-offs for these consumers are returning to their pre-pandemic levels faster than other groups.
Not surprisingly, the ripple effect of this deepening income-level divide impacts consumer sentiment along with spending. While surveys from June 2023 had shown similar levels of consumer sentiment between bottom-third earners and top-level earners, today higher-income households report a much more positive outlook compared to many lower earners who report feeling less confident in their own household finances.
And yet, 40% of consumers (across the divide) have expressed an intent to splurge over the summer months—so what different variations of delinquencies can we expect between the split of spenders? And how can businesses differentiate their approach to collections to more effectively recover debt faster?
How Does the Divide Impact Delinquencies?
Let’s start with the first question: what different types of debt are each income sector accumulating today?
Higher-income consumers: non-essentials and luxuries like travel, vacations, hotels, resorts, amusement parks
Surveys show that higher-income households are more optimistic about their ability to take trips and spend on luxuries like full-service hotels and resorts—in fact, 74% of respondents with annual household incomes of $100,000 or more plan to take a summer vacation and, across income levels, 36% anticipate taking on debt to pay for it.
We can even put a microscope to this ‘YOLO’ attitude towards spending on experiences by looking at Disney amusement parks. Surveys find:
- 45% of parents take on debt for Disney vacations
- $1,983 is the average amount of debt for those parents
- 75% report that their Disney trip did or would take six months or less to pay off
- Total respondents who went into debt during a Disney trip also increased 33% from a 2022 survey
Lower-income consumers: essentials like rent, utilities, everyday necessities
Conversely, the delinquencies for lower-income households start at home: 25% of low-income renters (defined by a Community Solutions survey as those with an annual income of less than $50,000) are 4-7 months behind on rent. And the New York Fed reported 57% of households are rent burdened in low-income areas, where they pay more than 30% of their monthly income on rent.
Even with wage gains over the last several years, 40% of consumers say they earn insufficient incomes and struggle to keep up with inflation and interest rates. And with approximately 75% of low-income households reporting living paycheck-to-paycheck, to bridge the gap there is an increasing reliance on credit cards to cover bills, so it is not surprising these consumers are falling behind on their credit card payments.
The spending divide leads to a divide on what consumers are going into delinquency for—so what’s the best way to engage and secure repayment when consumers’ financial situations and outlooks are so split?
How Can You Recover More Across Each Side of the Divide?
Regardless of where your customers fall in the divide, businesses must face facts: overall delinquent balances increased by 3.46% in June 2024 and then again in July by 0.51%. This paired with the fact that 1.11% of consumer accounts rolled into higher stages of delinquency marks an uptick in the roll rate in June compared to the improvement (decreases) seen in the past several months.
But with delinquency rates continuing to rise, it’s important to tailor your recovery approach to each consumer you seek to collect from with customized, omnichannel engagement.
A successful collections strategy goes beyond the simplified “tale of two consumers” and actually engages with individuals uniquely with the right message delivered through the right channel at the right time for them.
While getting payment reminders is beneficial for consumers across the divide, hovering between roughly 40% to 50% from the under $50,000 cohort all the way to the $100,000 and above bracket, the preference for how these reminders are sent varies across all consumers:
- 36% prefer text
- 32% prefer email
- 4% prefer a paper letter mailed
- 1% prefer receiving a phone call
But for most businesses, executing an advanced outreach strategy can be a major undertaking, especially for those used to relying on traditional call-and-collect methods. Partnering with TrueAccord can alleviate the potential strain on resources and simultaneously help you collect more faster.
TrueAccord not only engages your delinquent customers through this proven effective omnichannel approach, but also leverages our patented machine learning engine, HeartBeat, to effectively reach out to every account placed with a goal of getting them to repay on their own terms when they are ready. HeartBeat dynamically optimizes the next best touchpoint for every consumer in real-time, including the content, timing, and channel for each customer.
No matter where your customers fall in the consumer spending divide, TrueAccord has the right message, right channel, and right timing to recover more across the board.
Ready to get started? Schedule a consultation today»»
Sources:
- Federal Reserve Bank of New York Q1 2024 Quarterly Report
- Bloomberg
- Ramsey
- Axios
- Federal Reserve Board Publication May 2024
- New York Times
- McKinsey
- Bankrate
- USA Today
- Community Solutions
- New York Fed
- PYMNTS
- Ascend Market Insights Dashboard
- Report: Consumer Trends Driving the Future of Loan Payments

